Context
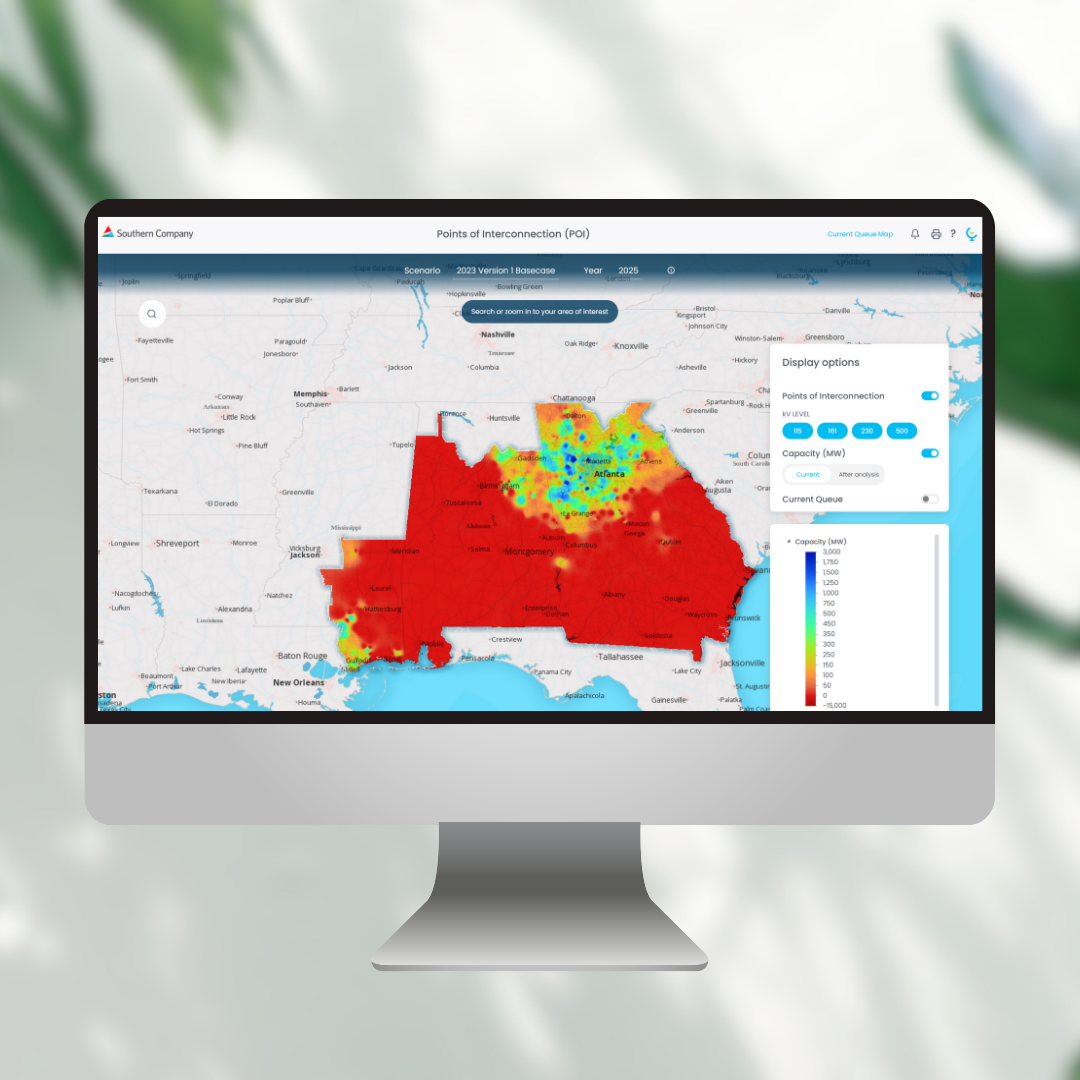
FERC Order 2023 mandates transmission providers to enhance transparency in generator interconnection procedures. This includes creating a public “Interconnection Heatmap” displaying available capacity in MW for each bus, allowing users to input desired MW and voltage levels for interconnection analysis, and providing a results table indicating the estimated impact of proposed projects on existing facilities.
In response to the Order, Southern Company (referred to as “SOCO” hereafter), a major gas and electric corporation in the southern United States, reached out to us to ensure compliance with FERC Order 2023.
Problem
- SOCO’s transmission team has little experience with interactive web maps.
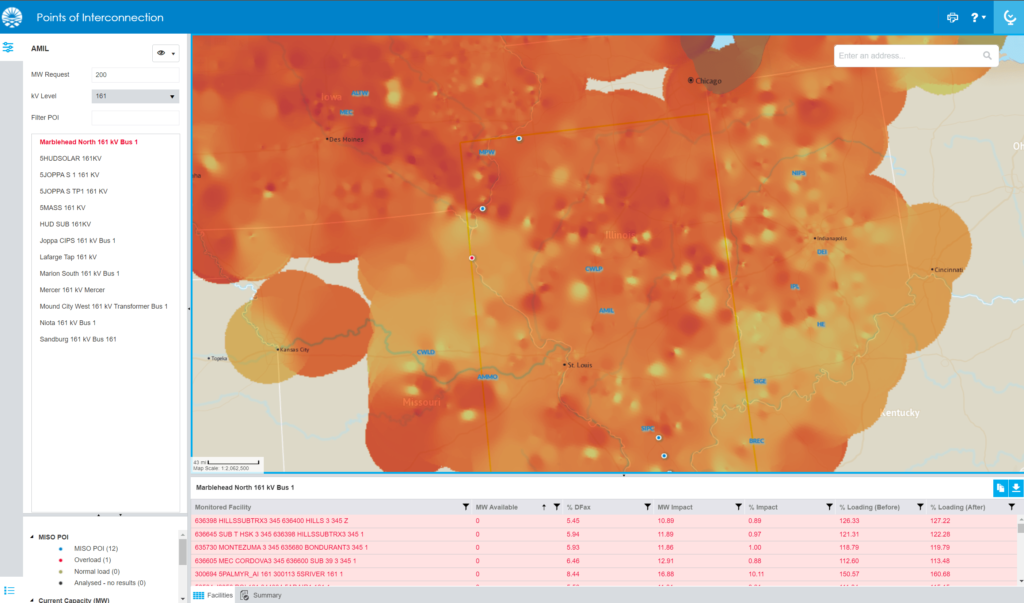
- SOCO identified a similar heatmap crafted previously by CartoVista, albeit found it challenging to navigate due to its intricate design.
- 1) Not sure what to do when first landing on the map
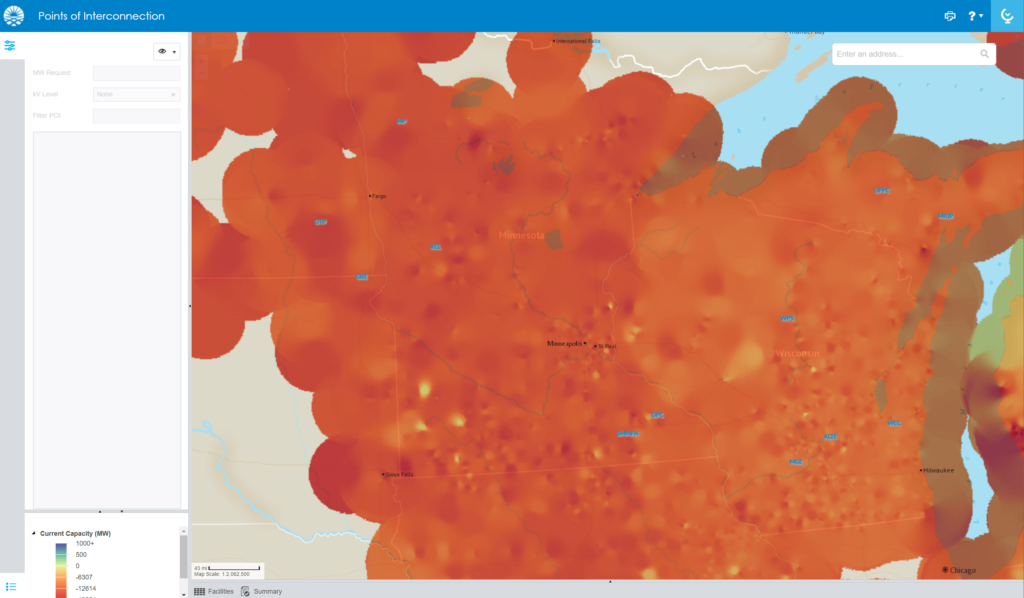
2) After zooming in on the map, it is not clear how they can enter a MW value on a POI location.
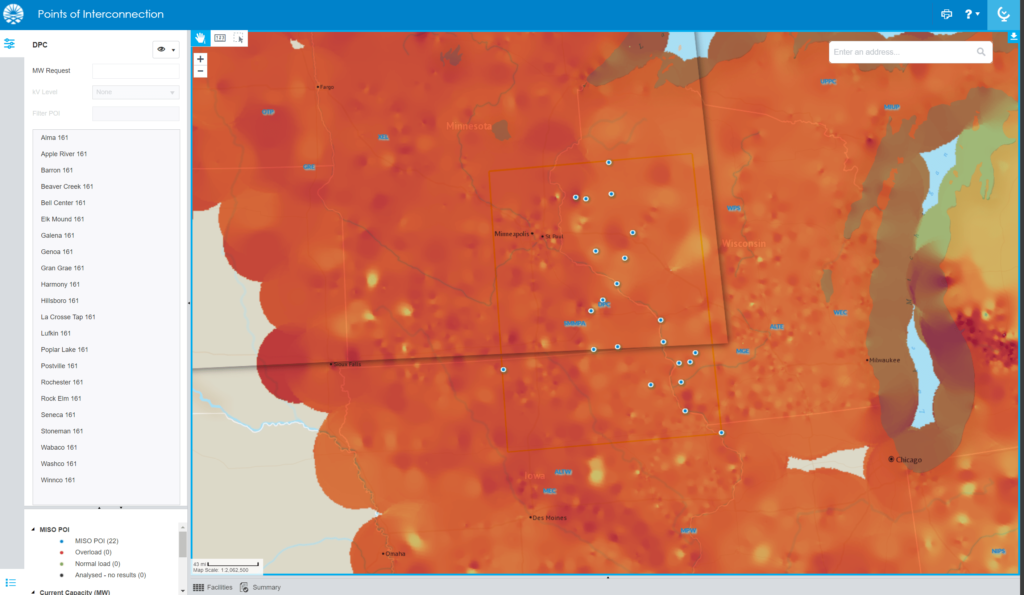
3) Counter-intuitively, users need to enter the MW number on the top left corner, select kv levels, and at last click on a POI (blue points on map) to view the analysis results.
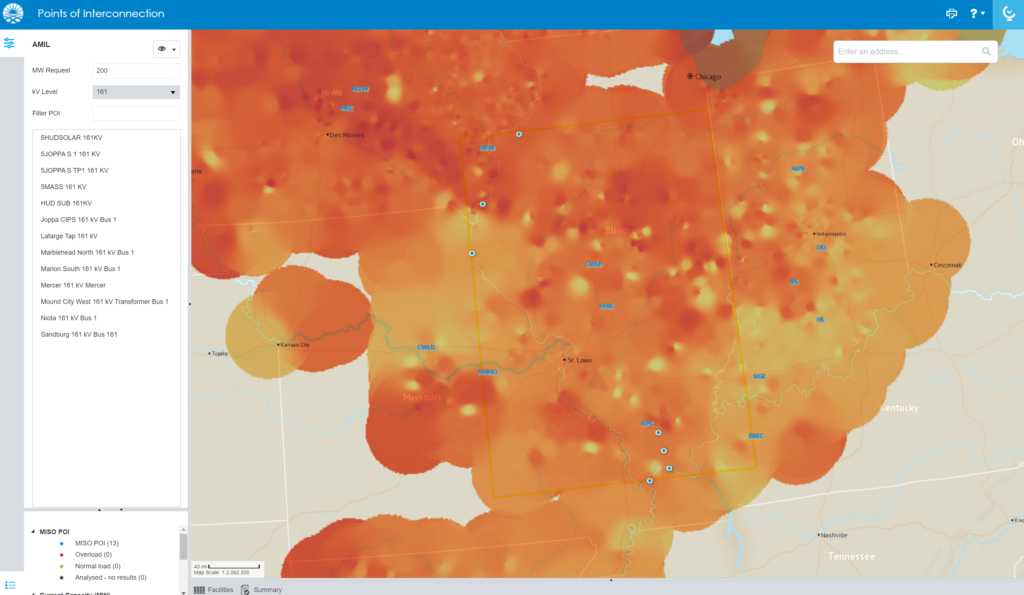
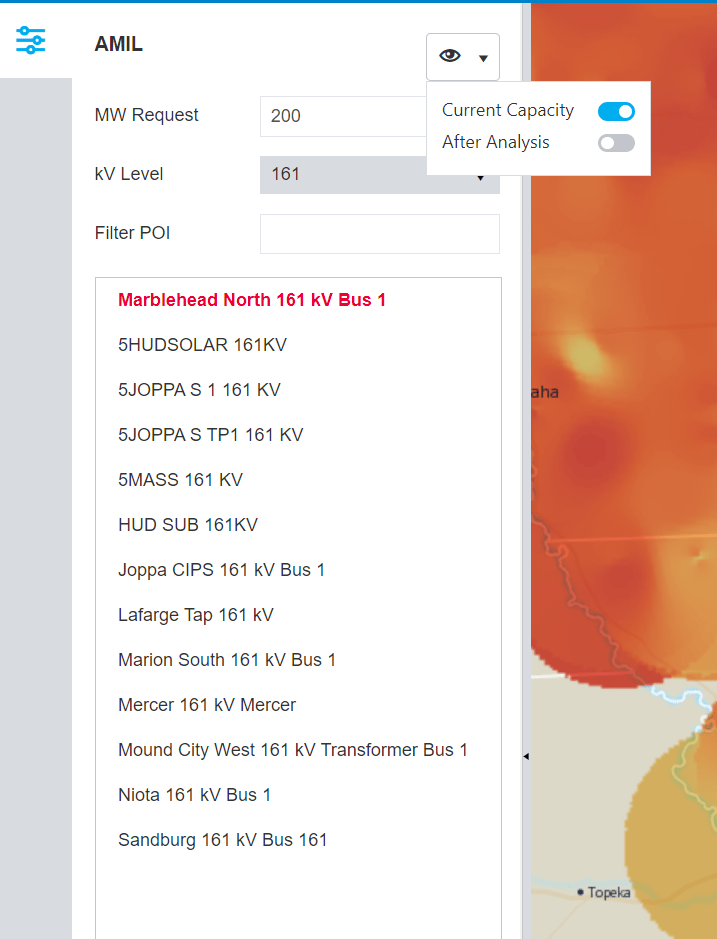
4) To compare the heatmap capacity Before and After entering the MW number, it is difficult to find the toggles that are hidden in an eye icon.
3. SOCO would like the viewers to make informed decisions about interconnections based on various scenarios and years.
4. SOCO would like to include a Current Queue Activity Map that shows current queue activity with location, MW value, and resource type.
Solution
1. 2. &3 – Designed an intuitive custom application interface from scratch
1) Overview
Once accepting the disclaimer, the public users can choose to take the onboarding tutorials or not depending on their levels of comfort with maps. They are able to view the heatmap based on interested scenarios and years.
2) Locate to an area of interest
Users can search or zoom in an area to view the POIs on the map and from the list. They can filter POIs by different kV levels to according to their needs.
3) Choose a POI
Users can search or directly click a POI on the map, and an input box pointing to their selected POI shows up.
4) Enter MW value for chosen POI
Enter the MW value, analysis results table is shown. In the Display panel, user can switch between the toggle under Capacity to compare current and after analysis capacity. On the results table, user can expand, copy, download, or clear the analysis.
5) Perform multiple POI analyses
Users can perform multiple POI analyses, not just one at a time.
6) Clear analysis
User can click the trash bin to clear analysis and start over. Meanwhile, they are free to toggle on / off any layers (Point of Interconnection, Capacity, Current Queue) as they see fit.
7) Print options
Users have the option to print/export the map in pdf or png format.
4. Designed a Current Queue Map
A Queue map showing projects submitted by public users according to different fuel types (i.e. Nuclear, Solar, Batteries, etc.).
The Queue map feature enables public users to sort projects based on various themes (such as Total Net MW, Request Status, etc.), facilitating the client’s access to a broader understanding of the projects submitted by the public.
Outcomes
- The client, SOCO, is extremely pleasant with the results.


2. Enhanced data transparency and FERC regulatory compliance for SOCO.
3. Positioned SOCO as a leader in innovation.
4. Demonstrated our ability to transform complex data into actionable insights, marking it a valuable ally in the energy innovation sector.
Key learnings
- Acquired an understanding of customer needs and crafted a sleek and polished user interface that completely satisfied the client’s specifications.
- Acquired expertise in engaging with stakeholders and developers through a series of joint application design sessions remotely to bring the product to fruition and iteratively enhance it.
